November 6, 2019
United States, New York
The estimated aggregate funding level of pension plans sponsored by S&P 1500 companies increased by 1 percent in October 2019 to 85 percent, as a result of an increase in equity markets. As of October 31, 2019, the estimated aggregate deficit of $371 billion USD decreased by $34 billion USD as compared to $405 billion USD measured at the end of September according to Mercer,[1] a global consulting leader in advancing health, wealth and career, and a wholly owned subsidiary of Marsh & McLennan Companies (NYSE: MMC).
The S&P 500 index increased 2.04 percent and the MSCI EAFE index increased 3.50 percent in October. Typical discount rates for pension plans as measured by the Mercer Yield Curve remained flat at 3.08 percent.
“Funded status increased slightly in October due to positive returns in the equity market,” said Matt McDaniel, a Partner in Mercer’s Wealth Business. “We saw the S&P 500 reach an all-time high in October, but persistently low interest rates have kept funded status from improving further. The looming question is whether we will see an end to this bull market in light of the historic run over the past decade. With low rates putting pressure on 2020 budgets, and the risk of a late-year market correction, plan sponsors should understand the sensitivity of 2020 pension liability and expense to rapidly changing market conditions.”
Mercer estimates the aggregate funded status position of plans sponsored by S&P 1500 companies on a monthly basis. Figure 1 (below) shows the estimated aggregate surplus/ (deficit) position and the funded status of all plans sponsored by companies in the S&P 1500. The estimates are based on each company’s latest available year-end statement[2] and by projections to October 31, 2019 in line with financial indices. The estimates include US domestic qualified and non-qualified plans, along with all non-domestic plans. The estimated aggregate value of pension plan assets of the S&P 1500 companies as of September 30, 2019 was $2.05 trillion USD, compared with estimated aggregate liabilities of $2.46 trillion USD. Allowing for changes in financial markets through October 31, 2019, changes to the S&P 1500 constituents, and newly released financial disclosures, at the end of October the estimated aggregate assets were $2.07 trillion USD, compared with the estimated aggregate liabilities of $2.44 trillion USD. Figure 2 shows the discount rates used in Mercer’s pension funding calculation.
Notes for editors
Information on the Mercer Yield Curve is available at http://www.mercer.com/pensiondiscount .
The Mercer US Pension Buyout Index may be accessed at http://www.mercer.us/our-thinking/mercer-us-pension-buyout-index.html
Unless otherwise stated, the calculations are based on the Financial Accounting Standard (FAS) funding position and include analysis of the S&P 1500 companies.
Figure 1: Estimated aggregate surplus/ (deficit) position and the funded status of all plans sponsored by companies in the S&P 1500
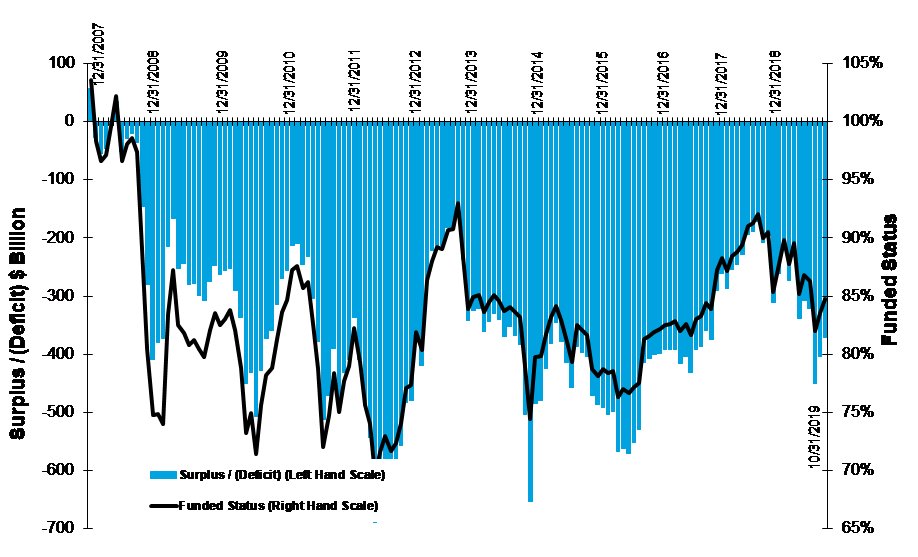
Source: Mercer, October 2019
Figure 2: High Quality Corporate Bond Yield and S&P 500 data points
Date
|
High Quality Corporate Bond Yield
|
S&P 500 Index
|
December 31, 2007
|
6.40%
|
1,468.36
|
December 31, 2008
|
6.34%
|
903.25
|
December 31, 2009
|
5.98%
|
1,115.10
|
December 31, 2010
|
5.33%
|
1,257.64
|
December 31, 2011
|
4.55%
|
1,257.60
|
December 31, 2012
|
3.71%
|
1,426.19
|
December 31, 2013
|
4.69%
|
1,848.36
|
December 31, 2014
|
3.81%
|
2,058.90
|
December 31, 2015
|
4.24%
|
2,043.94
|
December 31, 2016
|
4.04%
|
2,238.83
|
December 31, 2017
|
3.56%
|
2,673.61
|
December 31, 2018
|
4.19%
|
2,506.85
|
January 31, 2019
|
4.04%
|
2,704.10
|
February 28, 2019
|
4.09%
|
2,784.49
|
March 31, 2019
|
3.78%
|
2,834.40
|
April 30, 2019
|
3.84%
|
2,945.83
|
May 31, 2019
|
3.63%
|
2,752.06
|
June 30, 2019
|
3.44%
|
2,941.76
|
July 31, 2019
|
3.38%
|
2,980.38
|
August 31, 2019
|
2.95%
|
2,926.46
|
September 30, 2019
|
3.08%
|
2,976.74
|
October 31, 2019
|
3.08%
|
3,037.56
|
About Mercer
Mercer delivers advice and technology-driven solutions that help organizations meet the health, wealth and career needs of a changing workforce. Mercer’s more than 23,000 employees are based in 44 countries and the firm operates in over 130 countries. Mercer is a wholly owned subsidiary of Marsh & McLennan Companies (NYSE: MMC), the leading global professional services firm in the areas of risk, strategy and people. With nearly 65,000 colleagues and annual revenue over $14 billion, through its market-leading companies including Marsh, Guy Carpenter and Oliver Wyman, Marsh & McLennan helps clients navigate an increasingly dynamic and complex environment. For more information, visit www.mercer.com. Follow Mercer on Twitter @Mercer.
[1]Figures provided by Mercer Investments LLC
[2]Source of financial statement data: Standard & Poor’s Capital IQ. Standard and Poor’s is a division of The McGraw-Hill Companies, Inc. This may contain information obtained from third parties, including ratings from credit ratings agencies such as Standard & Poor’s. Reproduction and distribution of third party content in any form is prohibited except with the prior written permission of the related third party. Third party content providers do not guarantee the accuracy, completeness, timeliness or availability of any information, including ratings, and are not responsible for any errors or omissions (negligent or otherwise), regardless of the cause, or for the results obtained from the use of such content. THIRD PARTY CONTENT PROVIDERS GIVE NO EXPRESS OR IMPLIED WARRANTIES, INCLUDING, BUT NOT LIMITED TO, ANY WARRANTIES OF MERCHANTABILITY OR FITNESS FOR A PARTICULAR PURPOSE OR USE. THIRD PARTY CONTENT PROVIDERS shall not be liable for any direct, indirect, incidental, exemplary, compensatory, punitive, special or consequential damages, costs, expenses, legal fees, or losses (including lost income or profits and opportunity costs) in connection with any use of THEIR CONTENT, INCLUDING ratings. Credit ratings are statements of opinions and are not statements of fact or recommendations to purchase, hold, or sell securities. They do not address the suitability of securities or the suitability of securities for investment purposes, and should not be relied on as investment advice.