Since the emergence of the global coronavirus pandemic in 2020 we’ve seen equities fall violently[1], followed by a swift recovery such that the MSCI World Index, at the time of writing, was close to revisiting its all-time high. Although there do appear to be some reasonably consistent behaviors for equity factors and their performance during crashes and recoveries, over the medium term, individual factor performance tends to ebb and flow. This makes a strong empirical argument for maintaining diversified exposure across equity return drivers, or factors. Understanding these factor behaviors can also help provide context to active manager performance.
What factors are we talking about?
Investing in a balanced range of return drivers is a core part of Mercer’s advice for constructing robust equity portfolios. Value, quality, momentum, size and low volatility are five key factors that Mercer recommends investors have exposure to in order to help them ensure their equity portfolio has exposure to a diversified range of systematic return drivers. Each of these style factors has academic and empirical support.[2] The description of, and rationale behind, each anomaly/return premia is described in Figure 1.
Figure 1. Style factors and the rationale for their existence

Source: Mercer
How have these factors performed during crashes and recoveries?
Figure 2 illustrates global style factor performance during three of the major crises experienced in the last two decades. As we might expect to see, quality and minimum volatility factors tended to outperform during the thick of a contraction, as investors sold assets perceived to be higher risk in favor of those perceived to be safer. In contrast, value and small size factors generally led the market in an economic recovery.
Figure 2. Factor performance during three recent equity crises
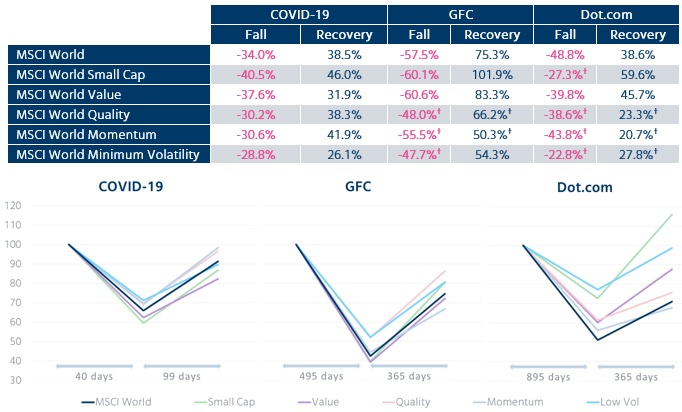
Source: MercerInsight™. Performance is based on the total return index value in USD. GFC/dot.com “fall” performance is peak to trough and recovery is subsequent 12 months from the trough. COVID “fall” is peak to trough and recovery is to 30 June 2020. Price index used for return calculation for dot.com period for MSCI World Small Cap index due to data availability. Please see Important Notices for additional information on indexes. †Includes back-tested index data.
The last two of these crises — the dot.com bubble and the Global Financial Crisis (GFC) — were similar in that both were catalyzed by sizable imbalances that were poised for adjustment. However, the nature of their respective imbalances were different. The former was driven by a valuation bubble where growth stocks (and companies with no earnings), particularly in the technology, telecom, health care and consumer sectors, were bid to unsustainable levels. The GFC, however, was driven by a debt bubble, fueled by low interest rates and poor lending standards, which led to a banking crisis.
Given these differences, factor performances around each crisis were, not surprisingly, also different. That said, the market recovery for both periods was consistent in that value and small cap led, while low volatility, quality and momentum factors all lagged by a significant margin.
Factor performance and active management during the COVID-19 crisis
Unlike the previous two crises, the most recent economic and market crisis was not driven by a bursting bubble, but instead caused by a shock to the economy, completely unrelated to the business cycle. In the midst of the first calendar quarter of 2020, COVID-19 quickly devolved into a global health crisis, plunging the global economy and stock markets from all-time highs into a global recession[3] and a 34% drop in the MSCI World Index in just over a month.[4]
Factor performance during the sell-off in the first quarter closely resembled that of the GFC, with low volatility, quality and large-cap style factors outperforming, while small cap and value lagged. However, compared to previous recoveries, the recent rally appears to have missed one key ingredient: a bounce in value.[5] Mercer’s thinking on this important question is covered in detail in our recent white paper: “Is there still a case for value?”.[6]
As illustrated in Figure 3, the performance of active managers during the COVID-19 sell-off largely echoed the returns seen in style factor indices. Active strategies with the most pronounced tilts towards value and away from large and mega-cap companies were the weakest performers during the first quarter of 2020. In contrast, those strategies with strong positive tilts towards quality and momentum or had a defensive/low beta bias generally showed positive relative results over the period. The dispersion amongst manager returns with similar exposures demonstrates the potential value (and cost) of decisions taken in how to implement those tilts.
Figure 3. Active global equity manager performance over the first quarter of 2020
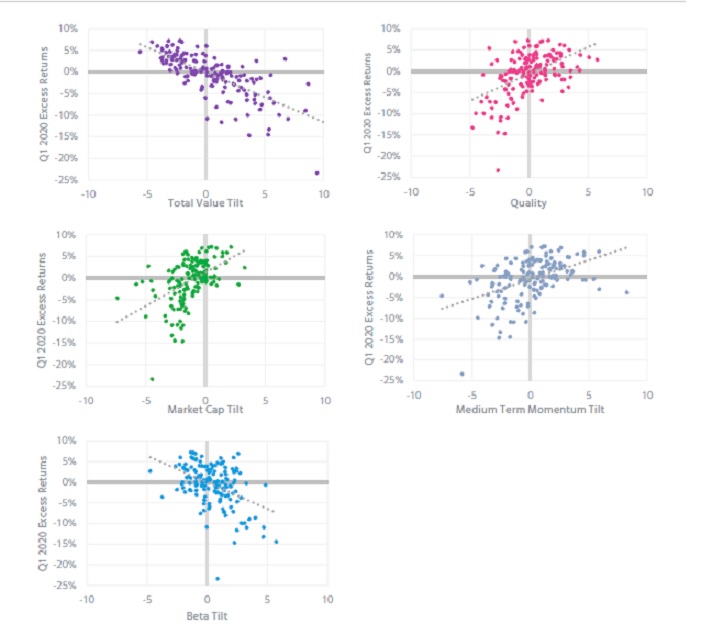
Source: StyleAnalytics, MercerInsight™. Performance shown is for Mercer’s active global equities (Core and All Countries) universes, and each manager’s performance is relative to their stated benchmark. All performance is to March 31, 2020. StyleAnalytics calculates portfolio tilts based on holdings as at December 31, 2019. Momentum, market cap, and beta are individual tilts. Mercer calculates the quality tilt using a 50/50 combination of the return on equity/low gearing individual tilts. The total value tilt averages the tilts of all individual value related tilts (book-to-price, dividend yield, cash flow yield, sales-to- price, earnings yield, and EBITDA to EV). Past performance is no guarantee of future results.
What does this all mean for investors?
While the stock market recovery has been swift so far, the extent of the underlying economic fallout is yet to be seen. As a result, the jury is still out as to whether the market recovery, to date, will be sustained. History suggests that if the current up-trend continues, value and small size factors should be rewarded, but if the news flow deteriorates, and markets reverse or plummet into a second dip, quality and low volatility should lead.
While we can look to history and reasonably recommend tilts to factors that have worked well in past recoveries, data points are limited and outcomes are anything but certain. In our view, no tilt should be prioritized at the expense of minimal exposure to the other well-known premia, which have been shown to benefit a portfolio’s risk-adjusted performance over a market cycle. The potential benefits of constructing a portfolio that is well-diversified by factor exposure is illustrated in the chart below[7].
Figure 4 – Rolling three-year factor index returns relative to MSCI World (Dec 2003 – June 2019)
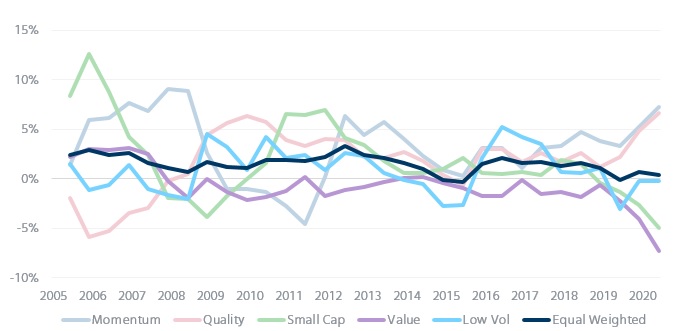
Source: MSCI Total returns (gross of fees) in US dollars. Data as at 9 July 2020. All performance shown relative to the MSCI World Index at six-monthly intervals. Equally-weighted portfolio is a composite of all five factor indices shown (momentum, quality, small cap, value, low volatility).
We cannot know what lies ahead, or how financial markets will respond. However, by diversifying exposure across multiple return drivers, we believe investors will have a greater chance of ensuring that their equity portfolio is sufficiently robust to weather short-term market volatility, while also being positioned to deliver favorable risk-adjusted outcomes independent of what shape the recovery ultimately proves to take.
[1] In a recent article, Where do we go from here?, this fall was put into recent historical context. https://www.mercer.com/our-thinking/wealth/where-do-we-go-from-here.html
[2] Value; Small Size: Fama, E. F.; French, K. R. (1993). "Common risk factors in the returns on stocks and bonds". Journal of Financial Economics.Quality/Profitability: Fama, E. F.; French, K. R. (2015). "A Five-Factor Asset Pricing Model". Journal of Financial Economics.Momentum: (1) Levy (1967); (2) Grinblatt and Titman (1989); (3) Jegadeesh and Titman (1993); (4) Chan, Jegadeesh and Lakonishok (1996) Low Volatility: (1) Black, Fischer; Jensen, Michael (1972). "The capital asset pricing model: Some empirical tests". Studies in the Theory of Capital Markets; (2) Jensen, Michael C., Black, Fischer and Scholes, Myron S.(1972), “The Capital Asset Pricing Model: Some Empirical Tests”, Studies in the theory of Capital Markets, Praeger Publishers Inc., 1972; see also Fama, Eugene F., James D. MacBeth, “Risk, Return, and Equilibrium: Empirical Tests”, The Journal of Political Economy, Vol. 81, No. 3; (3) Haugen, Robert A., and A. James Heins (1975), “Risk and the Rate of Return on Financial Assets: Some Old Wine in New Bottles.” Journal of Financial and Quantitative Analysis, Vol. 10, No. 5 (December): pp.775–784, see also Haugen, Robert A., and A. James Heins, (1972) “On the Evidence Supporting the Existence of Risk Premiums in the Capital Markets”, Wisconsin Working Paper, December 1972
[3] On 27 March 2020, The International Monetary Fund (IMF) declared a global recession. https://www.imf.org/en/News/Articles/2020/03/27/sp032720-opening-remarks-at-press-briefing-following-imfc-conference-cal
[4] Source: MercerInsight™
[5] MSCI World Value underperformed the broad market by 3.9% in the period from the market low (23 Feb 2020) to the end of May 2020.
[6] https://www.mercer.com/our-thinking/wealth/is-there-still-a-case-for-value.html.
[7] Seldom do factors all concurrently perform favorably or unfavorably together. As shown in the exhibit, factors within global equities have proved highly diversifying. We therefore encourage investors to seek to balance their exposures to a range of return drivers that have been shown to be both return enhancing and diversifying.

